
By Boris Glick, Senior Systems Engineer
Pyramid Solutions develops and provides ongoing support for a complex set of software components that enable communications and operations with vehicle ECUs. Recently, we added support for the communication protocol “XCP-on-CAN.” Instead of developing the high-level support for the protocol from scratch, we took advantage of the high-level XCP-on-CAN implementation provided by an existing third-party software library, “ASAP2Library.” While the ASAP2Library provides the higher-level protocol implementation, the low-level CAN communications were routed through our communication components. For clarity, we shall call the part of the components that provide low-level CAN/J1939 communications, “Low-level CAN.” The “Low-level CAN” connects to various CAN networks over the industry standard RP1210 protocol.
For more details on the ASAP2Library, visit: https://jnachbaur.de/index.html
Integrating with ASAP2Library
The development effort concentrated on three main parts: Data Transfer library, CAN Provider 1 (production), and CAN Provider 2/IP server (Test).
Data Transfer Library
The ASAP2Library is written in managed code (.NET/C#), while our components are written in C++ and compiled into native code. The high-level interaction between managed ASAP2Library and non-managed components calls for developing managed layers, that would comply with the ASAP2Library requirements on the managed side, while exposing COM interfaces for the native code. From here down, we will call the top-level integration layer “Data-transfer library”.
ASAP2Library defines a way of writing “CAN Provider” classes, that allow introducing new low-level protocols into the library. A “CAN Provider” needs to implement a set of interfaces defined by the ASAP2Library. We developed two such “CAN Providers,” one for production-time CAN communications, and one for testing.
CAN Provider 1 (Production)
The CAN provider 1 (production) connects to the “Low-level CAN” component mentioned above, which in turn connects to CAN networks over RP1210. This allows ASAP2Library to send and receive CAN traffic over the RP1210 interface.
CAN Provider 2/IP Server (Test)
In addition to integrating ASAP2Library with the production components, we needed to integrate it with the components’ test suite. The test suite implements an IP socket-based client/server architecture, that was designed to use CAN adapters remotely. The IP Socket Client is a DLL that exposes an RP1210 interface, so “Low-level CAN” can load it as a standard RP1210 driver on the testing workstation, while the IP Socket Server runs on the remote machine, routing IP socket traffic to/from a remote instance of “Low-level CAN,” which opens a CAN adapter on the remote machine.
ASAP2Library provides its own testing environment, complete with an ECU simulator. The ECU simulator uses ASAP2Library to connect to CAN networks. To use the ECU simulator in tests, we needed to route the CAN traffic from the “Low-level CAN” to the ECU Simulator.
For that purpose, the CAN provider 2/IP server (Test) implements an IP socket server compatible with the components’ test suite socket architecture. It is loaded by the ECU Simulator (running in a separate process) and listens for upcoming requests from the IP socket clients. When the sockets are established, the server routes the simulated CAN traffic to/from the ECU simulator.
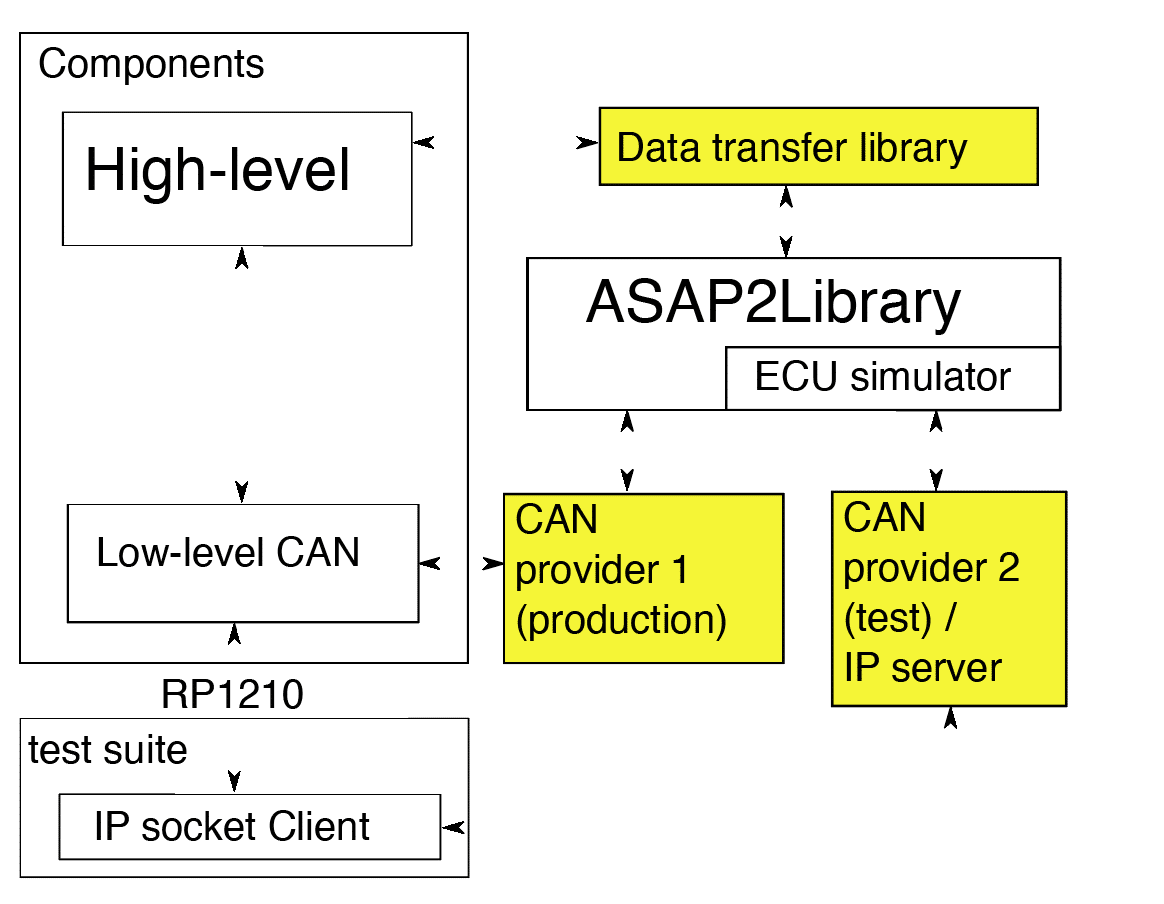
ASAP2Library Communications Interface
To be a CAN provider for an ASAP2Library, a class needs to implement two interfaces:
- ICANProvider with methods like open() and send() for transmitting outgoing CAN frames;
- IFrameProvider with methods like registerClient()/unregisterClient() for registering event handlers that process incoming CAN frames.
The library also contains helper classes CANProvider and FrameProvider that provide a customizable partial implementation of the ICANProvider and IFrameProvider interfaces.
Using the CANProvider/FrameProvider helpers required significantly less effort than implementing the complete interfaces from scratch. The library comes with multiple existing CAN providers, all taking advantage of CANProvider/FrameProvider helpers.
For that reason, both CAN provider 1 (production) and CAN provider 2 (test) were implemented by extending the CANProvider helper class from the ASAP2Library.
The Flow of CAN Communications During Production
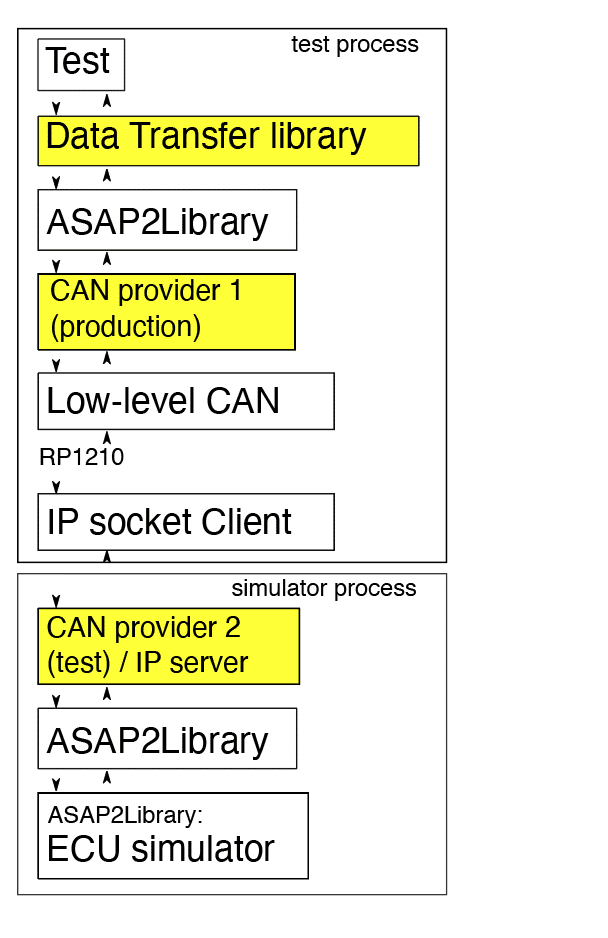
During production, an application would load the Data Transfer library, configured to connect to the CAN provider 1 (production). The CAN provider 1 loads the “Low-level CAN” component, which is configured to connect to a CAN adapter installed on the PC via the RP1210 interface:

The Flow of CAN Communications During Testing
When testing the Data Transfer library, each test setup starts two processes: The test process and the simulator process.
The simulator process starts the ECU simulator and configures the ASAP2Library to connect to the CAN provider 2 (test)/IP server, which starts listening for the incoming connections.
In the test process, the test application loads the Data Transfer library, and configures it to connect the ASAP2Library to the CAN Provider 1, which in turn tells the “Low-level CAN” to load the IP socket Client, which connects the IP server in the simulator process, completing a simulated CAN network:
The Performance Problem
A single test, simulating an upload of contiguous 32Kbytes from the ECU simulator, was taking almost four minutes (220 seconds) to complete. This was significantly slower than could be expected from a system that was supposed to be limited by CAN bus speed. In general, tests over the simulated network should be *faster* than real-life CAN communications. These observed speeds were a clear indication that something was seriously wrong.
Initial Analysis
The test was using an XCP-over-CAN protocol without any optimizations. This meant that the data was transmitted in 7-byte frames, each frame causing a complete request-reply roundtrip between the test thread and the simulator. 32768 bytes require 4682 7-byte frames, so an average data rate was very slow, around 21 frames per second.
Troubleshooting
The initial difficulty was finding the relevant parts of several interconnected bodies of code. There were two processes with multiple threads, some managed and some unmanaged, multiple events, multiple loops, and multiple packet queues.
This type of scenario is difficult to diagnose with a regular debugger or logging, but MS Concurrency Visualizer is well suited for the task.
Using MS Concurrency Visualizer
1. Introduction
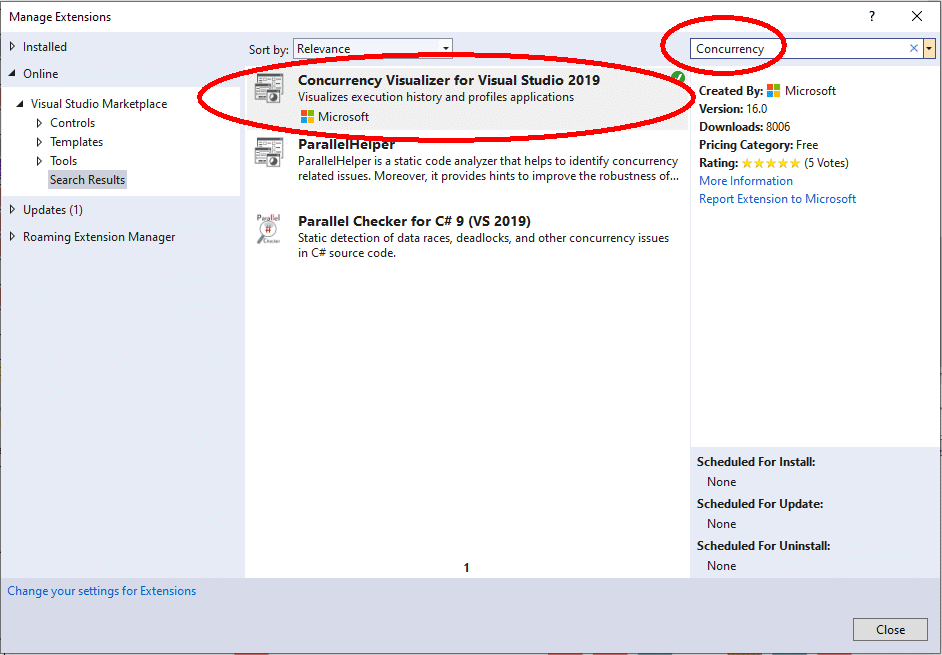
MS Concurrency Visualizer is a Visual Studio extension, available on Visual Studio Marketplace. It is published by Microsoft. To install it, access the Visual Studio Marketplace via the Manage Extensions menu:

2. Using MS Concurrency Visualizer from Visual Studio
After MS Concurrency Visualizer is installed, it becomes available via the “Analyze” menu:

Usage
After Concurrency Visualizer is installed, it needs to run for a time, collecting the data while the process of interest is running. The data collection can be stopped manually at any point, or it stops automatically when the process exists. After the data collection is complete, the Concurrency Visualizer processes collected data and generates a report (this can take several minutes).
Initial Capture (Main Process)
Concurrency Visualizer reports have three tabs:CPU, Cores and Threads. In this case, the first two reports are not very interesting, except that they show that the CPU is mainly idling.
The results of the initial capture of the run of a testing process are shown below:
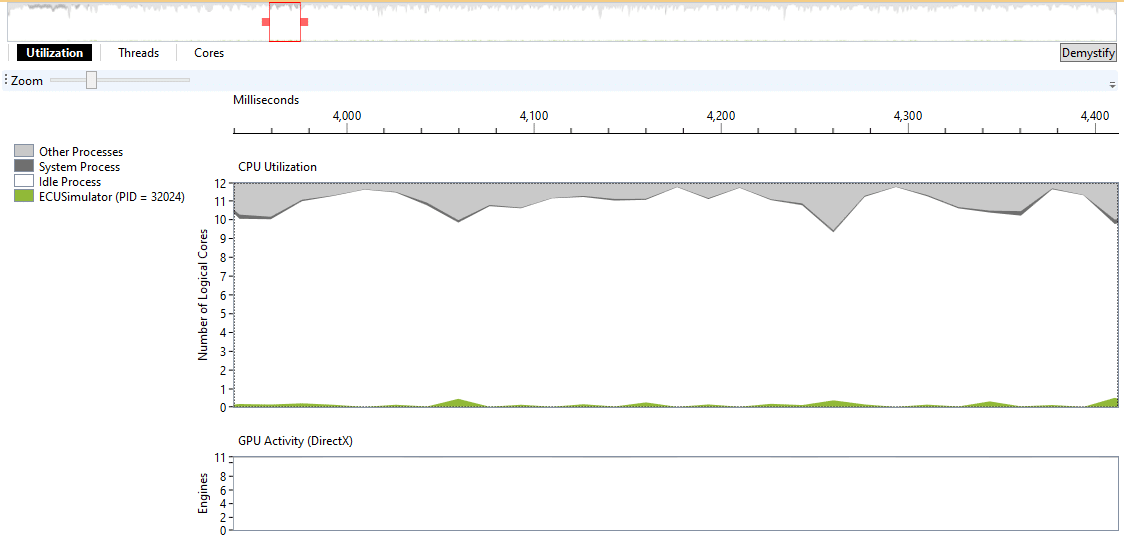
Figure 1: Initial Capture — CPU View
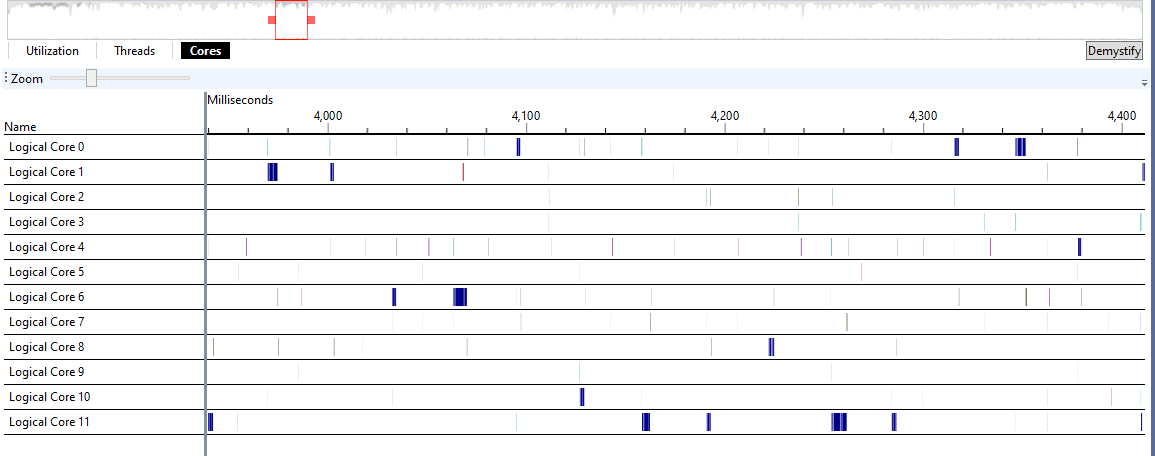
Figure 2: Initial Capture — Cores View
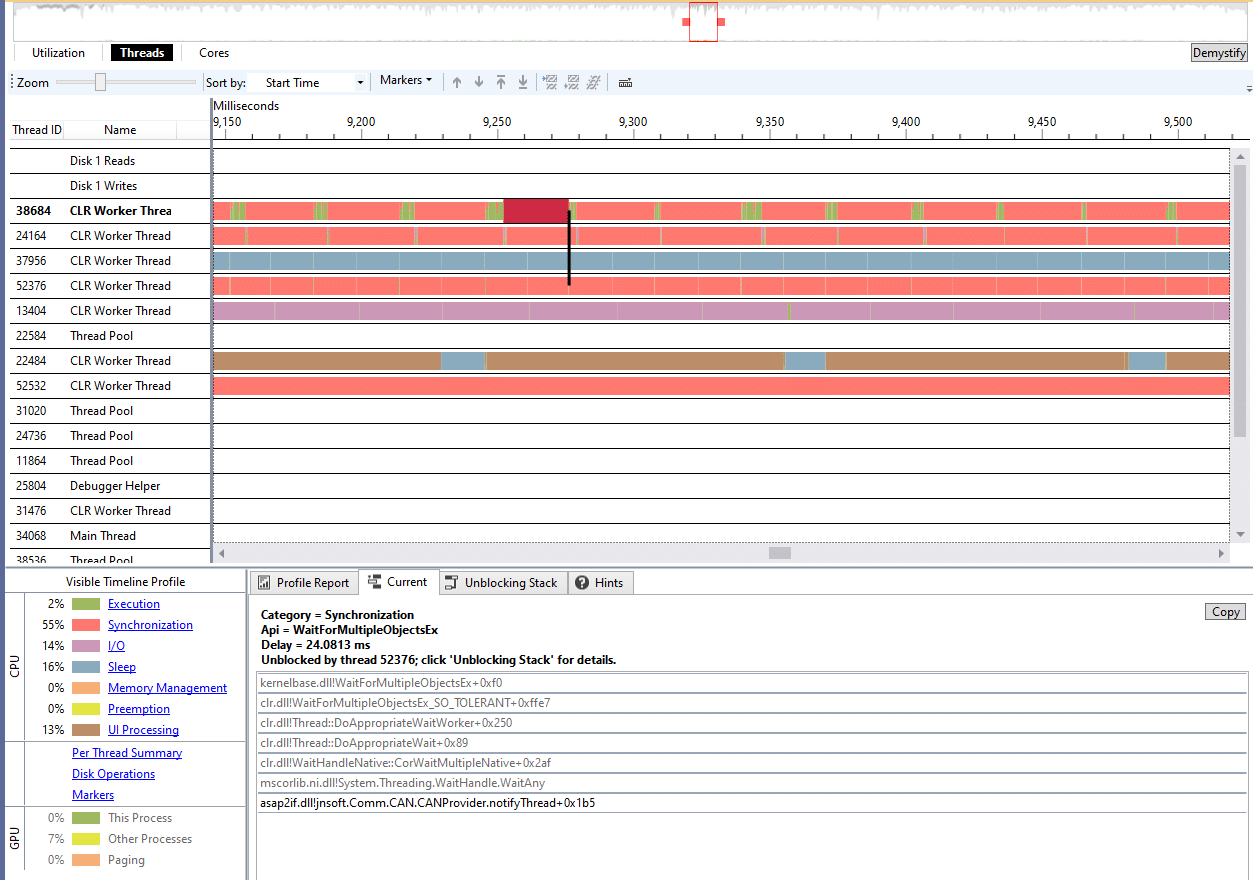
Figure 3: Initial Capture — Threads View
The performance data captured in the Utilization tab (Figure 1) and the Cores tabs (Figure 2) show that the CPU is mostly idle. The test spends the majority of its time waiting.
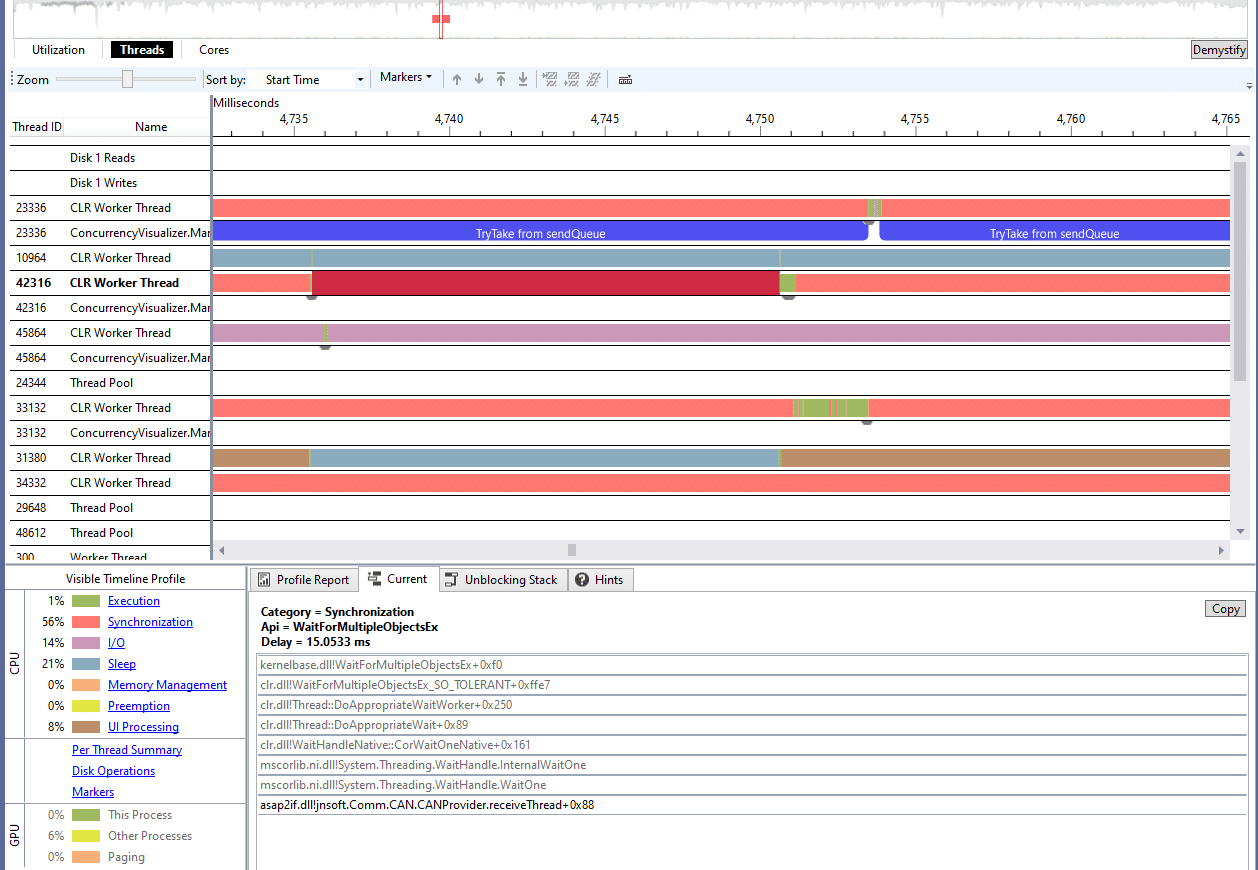
The most detailed information is found in the Threads tab. Whenever a thread is waiting on a blocking object (such as event), Concurrency Visualizer displays the function call stack of the waiting thread and a dark line pointing to the unblocking thread. The tabs on the bottom allow looking into the function call stack of the “unblocking thread” – the one that called the function that unblocked the thread.
While the Utilization and Cores tabs provide useful general statistics, the Threads tab is very specific, and can point to a single line of code within an individual function. In this case, it provided enough in-depth information to find the root cause of the problem.
Note that for this to work best, all modules of interest need to be compiled with debug symbols available.
One important clue was provided by the observed timing. The waits were close to either around16ms or 30ms. Such a pattern was likely to be caused by straight-up polling without synchronization (a “read” from a queue, followed by a “sleep”, instead of a synchronized “wait”).
Also note that the Threads view contains information similar to a classic “sequence” diagram, turned ninety degrees. Below is an example of a sequence diagram that was built by clicking on various parts within the Threads view, and recording the results:
Sequence (main process)
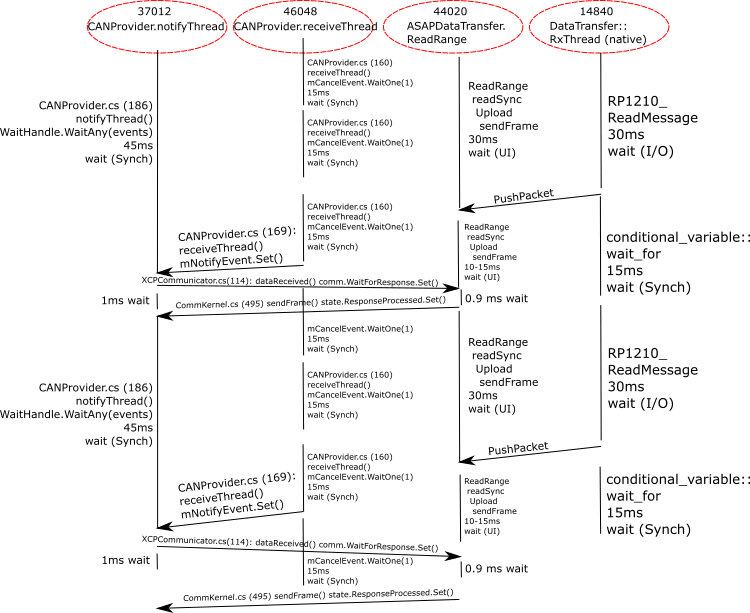
The initial data flow analysis of the main process did not reveal any drastic problems, so the follow-up analysis concentrated on the test/simulator process.
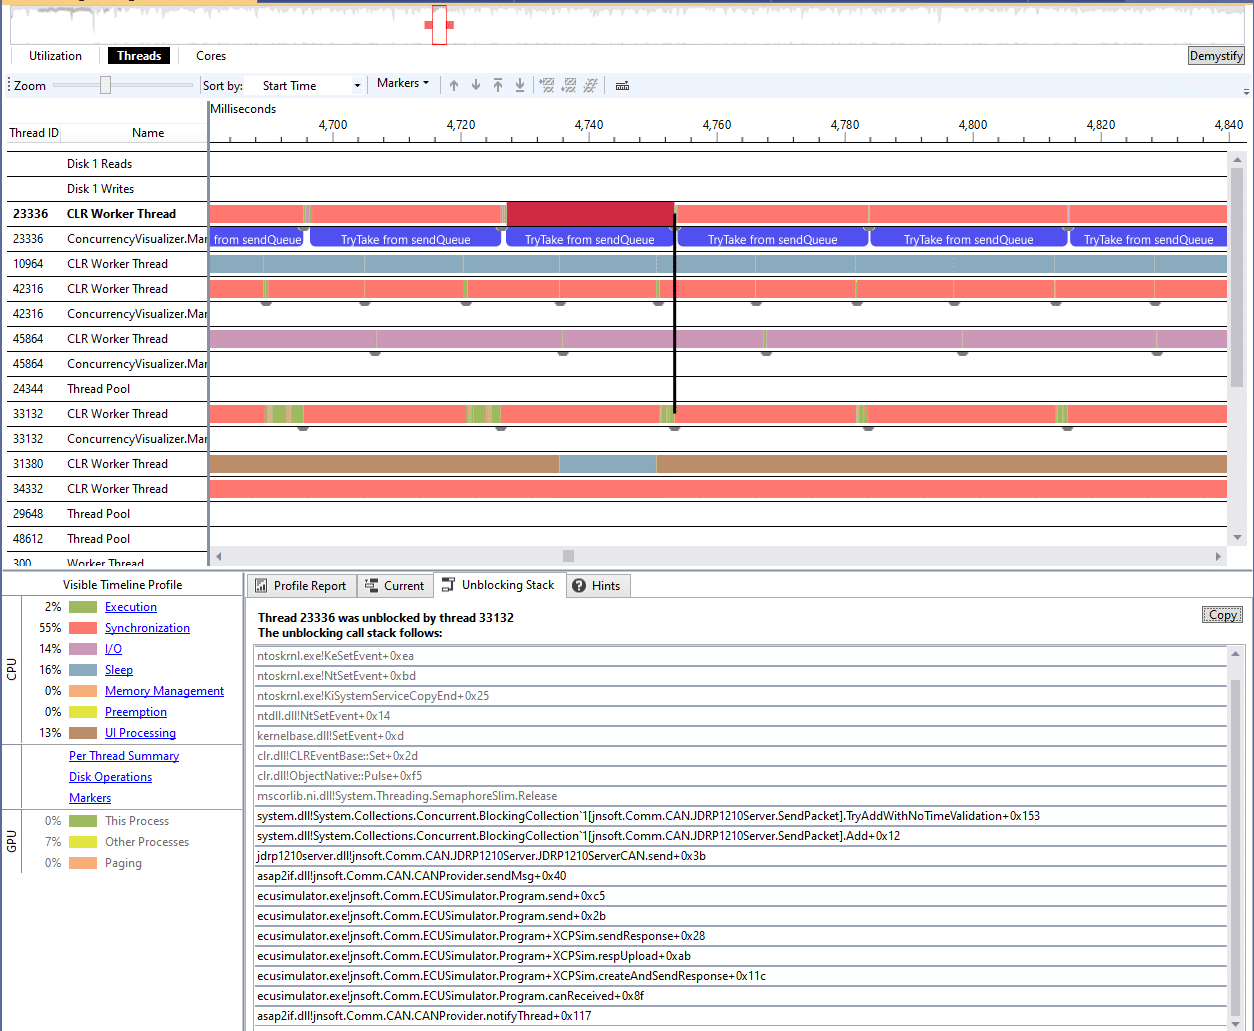
Concurrency Visualizer also provides both managed and non-managed SDK, that allows the code to emit custom “markers” – single-point events and intervals that display in Concurrency Visualizer reports.
To clarify the output, the Concurrency Visualizer SDK was added to the ASAP2Library project, and the source code was modified to output Concurrency Markers.
One example (in C#) adds a “span” with a message “TryTake from sendQueue” to the function within the IP Socket server that checks for the outgoing CAN frames, that the ECU Simulator placed into the sendQueue (TryTake is a blocking wait for the BlockingCollection concurrent queue in C#):
SendPacket packet;
var span = cv.Markers.EnterSpan("TryTake from sendQueue");
if (threadParams.ctx.sendQueue.TryTake(out packet, nWaitMsec))
{
The “receiveThread” function in CANProvider
When analyzing various threads, we noticed that when we switch the focus to the “receiveThread” within the CANProvider helper class from the ASAP2Library, the end of the wait is not triggered by an event:
internal protected sealed override void receiveThread(object state)
{
 var localList = new List<CANFrame>(); while (true)
{
   localList.Clear();
while (0 == onReceive(out CANFrame frame) && frame != null)
    {
       localList.Add(frame);
  }
    if (localList.Count == 0)
   {
 if (mCancelEvent.WaitOne(1))
 break;
        continue;
       }

      // set signal for notify thread
       mNotifyEvent.Set();
}
}
The “onReceive” function in CANProvider 2
The “onReceive” function is declared as “abstract” within the CANProvider helper class from the ASAP2Library. It must be implemented by all CAN providers that extend CANProvider, so that CANProvider can poll it for CAN frames:
/// <summary>
/// Cyclically called to receive CAN or LIN frames.
///
/// - Provides all CAN/LIN frames read from the CAN/LIN bus
/// - The method should never block
/// </summary>
/// <param name="frame">The CAN/LIN frame received or sent, or null if no frame is received or sent</param>
/// <returns>0 if no error occured (The frame parameter may be null in this case, too)</returns>
public abstract int onReceive(out T frame);
public override int onReceive(out CANFrame frame)
{
   if (!ctx.recvQueue.TryDequeue(out frame))
{
frame = null;
}
 return 0;
}
void receiveThread(object state)
{
   while (true)
  {
  Call onReceive in a loop as long as it returns frames;
    if (no frames returned)
   {
 Sleep();
     }

     Wake up other thread to do more work.
    }
}
Since receiveThread is a part of the library and is declared as “locked”, we decided to address the problem in onReceive, perhaps by adding a short wait on recvQueue.
The first attempt at fixing the problem
Originally, recvQueue was declared as a ConcurrentQueue, which does not provide synchronized waiting. So, we switched recvQueue to a BlockingCollection, and used TryTake instead of TryDequeue:
public override int onReceive(out CANFrame frame)
{
  if (!ctx.recvQueue.TryTake(out frame, 1))
     {
          frame = null;
  }
  return 0;
}
In effect, the above implementation always sleeps after it emptied the queue, and before it returns control to receiveThread. We actually made things worse — not only is the unwanted sleep still there, but now we also wake up the notifyThread only after we sleep.
The Final Fix
To fix both issues, we needed onReceive to remember whether it returned frames during the previous call, and sleep only after the caller (receiveThread) had woken up the notifyThread:
 public override int onReceive(out CANFrame frame)
{
    if (!ctx.recvQueue.TryTake(out frame, bReturnedFrame ? 0 : 1))
     {
bReturnedFrame = false; // a new class variable
        frame = null;
}
 else
  {
  bReturnedFrame = true;
   }
   return 0;
}
Results and Conclusion
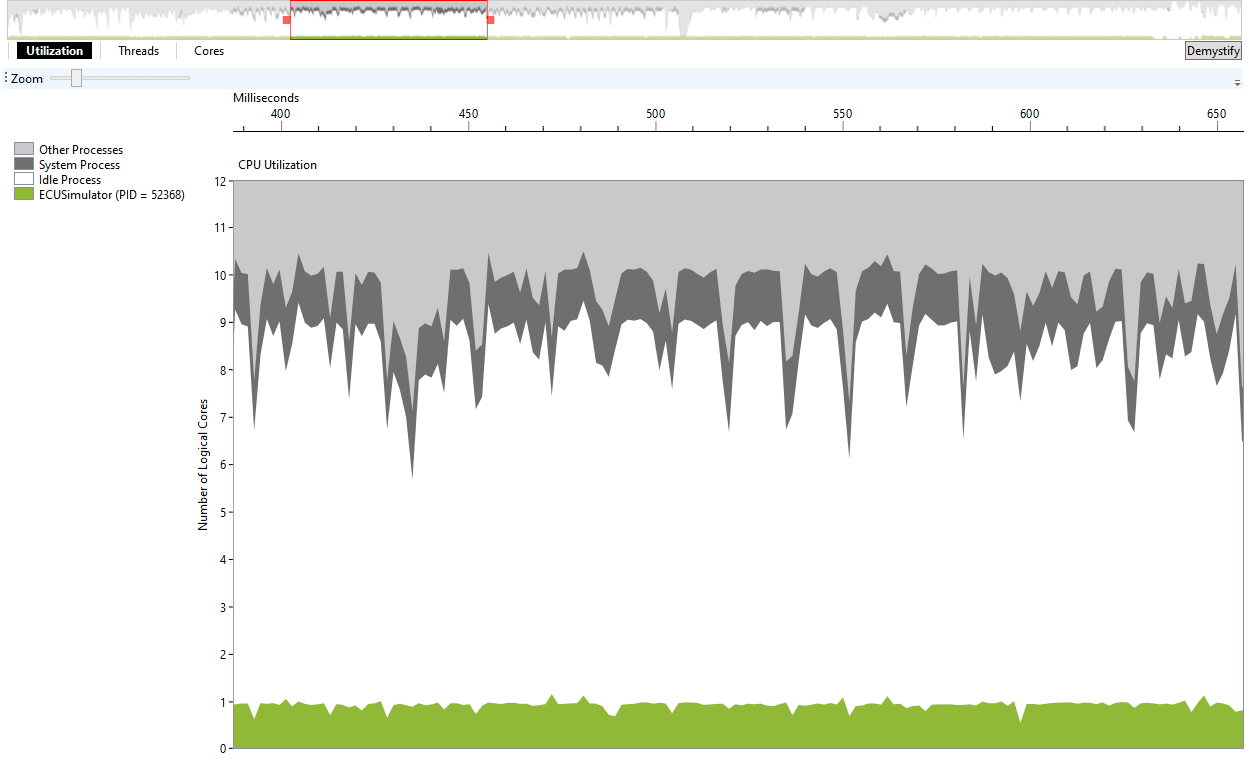
After applying the fix, the test time changed from 220 seconds to 1-2 seconds. Concurrency Visualizer reports much higher CPU utilization:
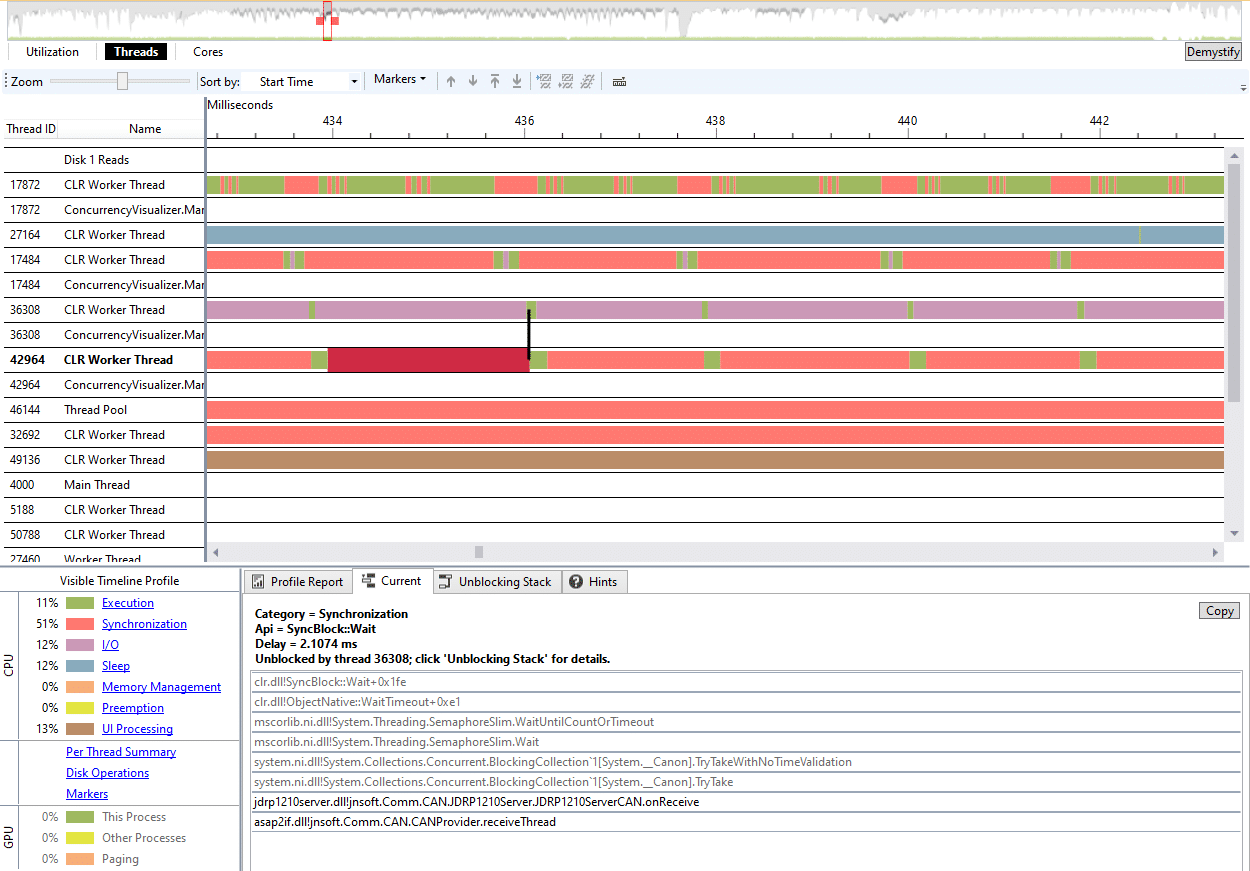
And the receiveThread now only sleeps for 2ms:
As you can determine, Visual Studio Concurrency Visualizer is a highly useful tool for tough multithreading problems.
