
Sequencing automotive parts consist of real-time communication with the customer and suppliers, building products in a set order, and shipping quality products on time. Because of the nature of JIT manufacturing, it is critical for manufacturers to have real-time reports of their sequencing processes.
As the need for visibility is so important, we thought we’d share some reports our clients are using today. Below are seven reports that our clients use every day to keep the constant flow of real-time information visible and ensure their production goals are met.
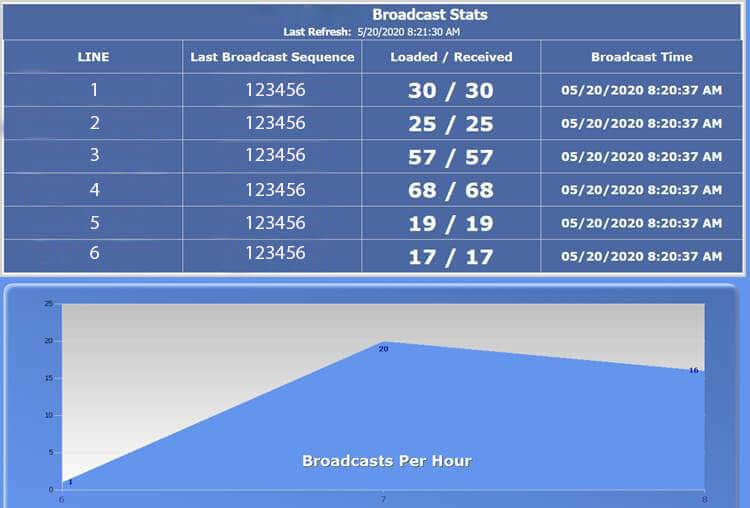
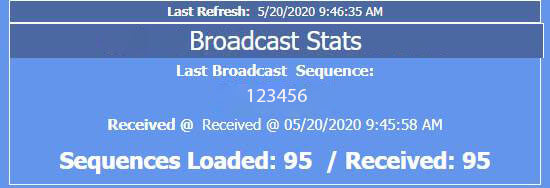
1) Broadcast Stats Report
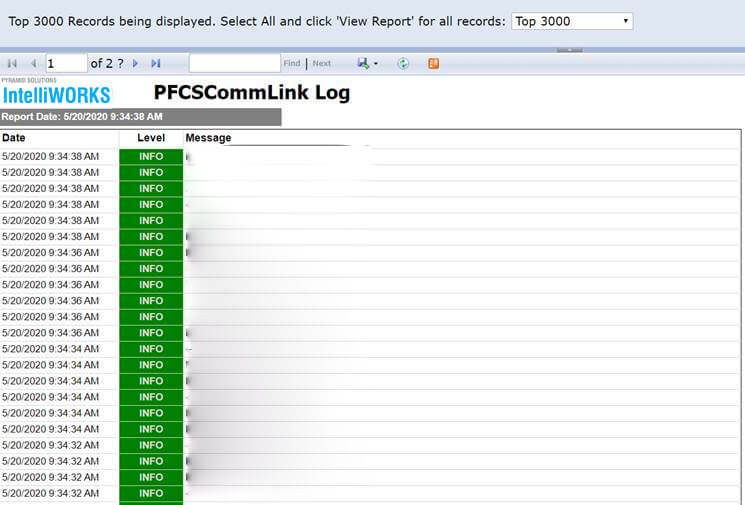
2) PFCSCommLink Log
The PFCSCommLink Log gives a more detailed status of the service that is handling the communication/broadcasts from the assembly plant like we discussed in the first report. It allows you to know whether that communication link is up and running and if you’re processing things properly.
If you’re looking at the broadcast stats and see that you haven’t received anything for an hour, you could look in this report log and see if there’s a problem.
3) Hour Count Report
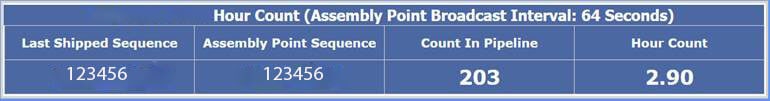
With this report, you can see the estimated number of parts that are in your customer’s assembly plant. Based on your customer’s usage rate, you’ll know how many hours of parts are left to run before your customer runs out of parts. Because it’s a live feed in a JIT manufacturing environment, you’re only building a couple of hours ahead of the assembly plant.
With such a small window from product to assembly, the hour count report allows you to react to the information and make decisions based on what broadcasts are coming in. For example, a low hour count indicates that the customer is in danger of running out of parts to use in their assembly process.
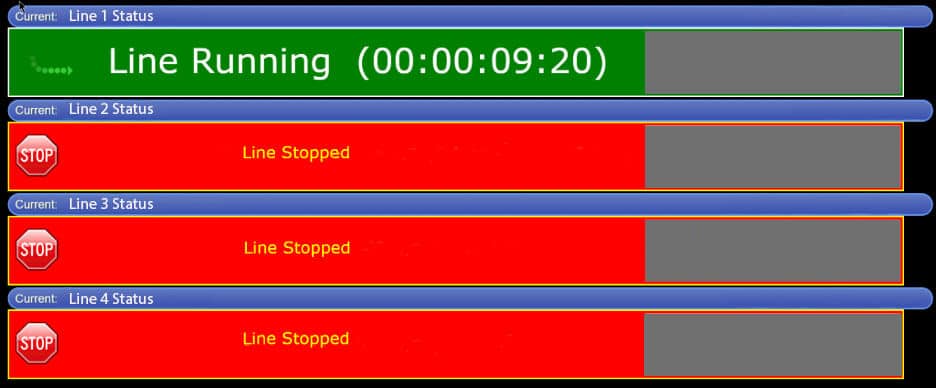
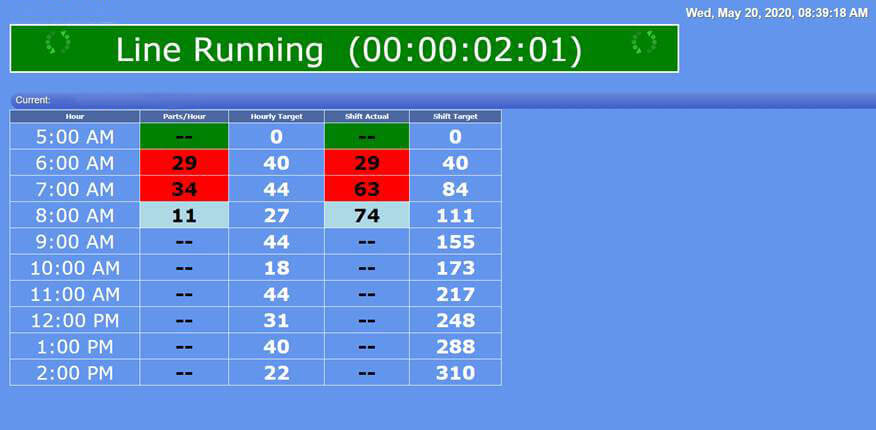
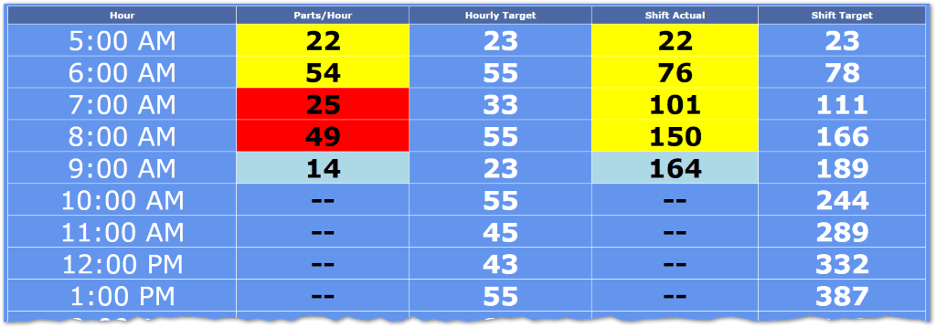
4) Line Status & Production Report
5) Container Status Report
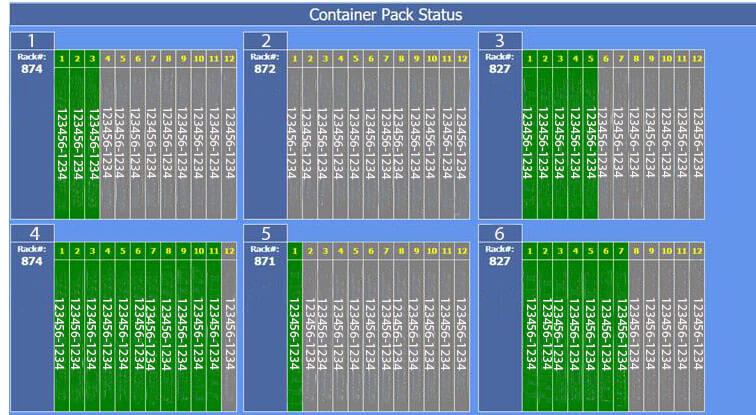
The above image is an example of a door line with six different container types. The right and left sequence numbers must match up because doors are shipped in pairs.
The report shows you where the parts are in the container and what part number and what sequence number goes into the container. Suppliers must guarantee that those are in the correct order when they get to the assembly line because the containers—and the parts inside them—must come out in the correct order to avoid slowing down or stalling assembly productions.
6) Container Shipping Report
You can tell what’s in the container based on the maximum and minimum sequence numbers. The numbers correlate to parts that go onto the assembly line, so they have to be in a specific order.
The important information to look for in this report is the rack number so that you can sequence your
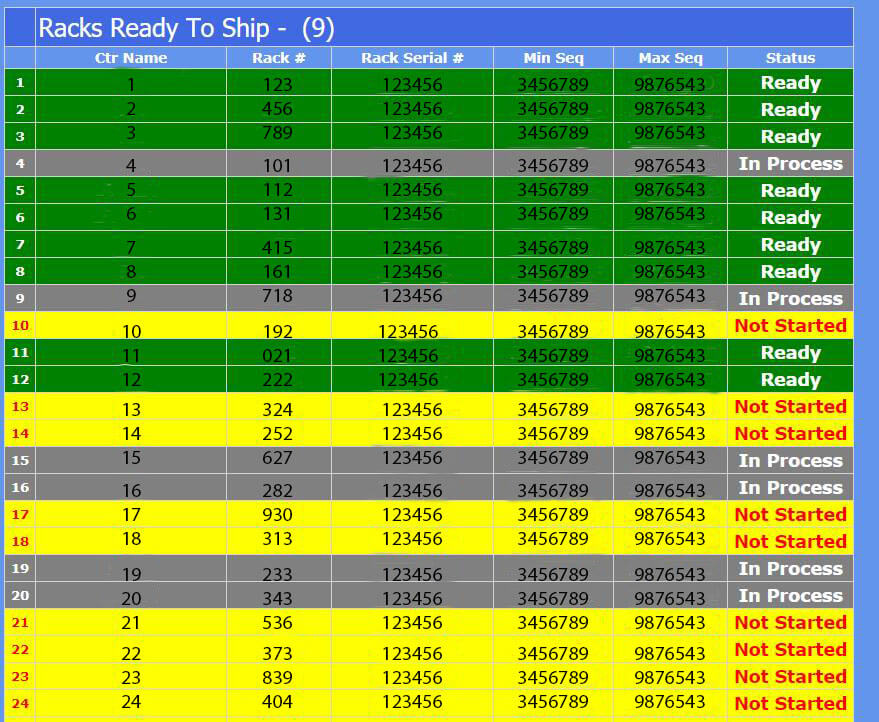
The assembly line tells suppliers the exact order of the parts they want. Suppliers have to make sure the parts are in the right order in the containers and that the containers are shipped in the right order when they come off the truck—again to avoid slowing or stalling production.
7) Jobs Report
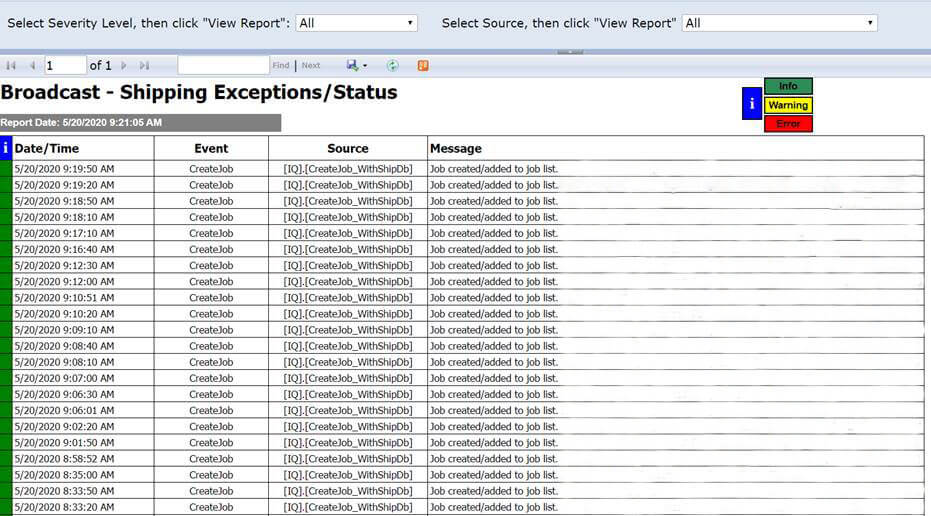
This image is the broadcast shipping exceptions status. If the broadcast shipping exceptions status is received but the load number doesn’t increase that means the jobs didn’t get processed and scheduled onto the line because of a problem, such as the part wasn’t configured. This report allows you to determine the issue, figure out what went wrong, and resolve it.
Succeed in Sequencing Automotive Parts
When you’re talking about sequencing there’s not a large margin of failure points between shipping a part and having it on the assembly line. Since everything is built JIT, every part and container must be in the correct sequence.
Assembly plants who have implemented JIS manufacturing don’t keep storage and inventory of parts, so it’s critical that everything is correct when it arrives at the assembly plant from the supplier. The seven reports we discussed ensure manufacturers continue to run on schedule with enough parts coming in to keep the lines moving.
The information in these reports gives decision-makers the visibility to see how the plant is running in real-time and adjust as needed. They can plan for back-ups in the supply line or assembly line, see where they are in production compared to targets, and drill down to see why a problem has come up and how to resolve it.
So, to help optimize your automotive sequencing process, make sure you keep in mind these seven reports:
- Broadcast Stats
- PFCSCommLink Log (Communication Report)
- Hour Count
- Line Status & Production
- Container Status
- Container Shipping
- Jobs
Do you want to save time and cut costs by implementing a manufacturing sequencing system? If you’re ready to improve your manufacturing plant’s operations, download our case study to learn how a tier 1 automotive supplier implemented a sequencing system and successfully reduced production costs, freed up floor space, and increased production volumes – or
Fill out the form below for more information or to contact sales!